Lots of remodelers fail every year because they fail to estimate costs properly, and lots of those who survive get caught in the trap of using money from the next job to pay debts on the previous job. Now, fresh data suggests it’s in your interest to help make sure your remodeling customers update the cost numbers they use to create estimates–often for jobs that won’t start for several months.
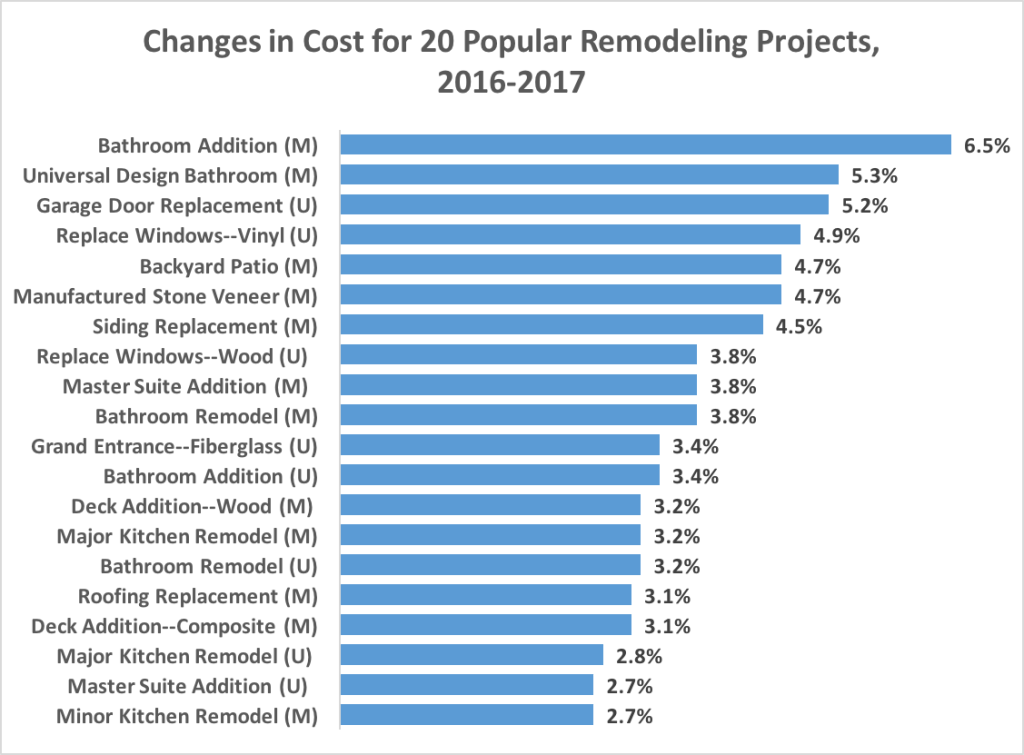
The chart above gives an advance look at some of the results of the 2018 Cost vs. Value report that REMODELING, a sister publication to ProSales, will publish in January. The chart above shows how the average national costs have changed for 20 common remodeling projects done by pros. The numbers come from RemodelMAX, a research firm that keeps track of labor and product costs in markets nationwide.
Note that these numbers reflect costs and changes from mid-year 2016 to mid-year 2017. They don’t encompass the run-up in lumber and other product prices that have occurred this fall and that already have led RemodelMAX to urge remodelers to adjust their cost estimates once again.
The (M) and (U) designations on the chart distinguish whether the project is meant to be a mid-range or upscale project. The difference between a midrange and an upscale project usually has to do with the scope of work and the complexity of the project. It also has to do with different quality standards for finishes. For details on each project, go to the Cost vs. Value home page and click on each project’s name.
If you’re never heard of Cost vs. Value, know that the projects involved are theoretical ones. By using a model project rather than focusing on actual work, and by using the same materials and the same amount of labor regardless of where the project occurs, we can more accurately determine how costs vary from market to market.
The costs listed in the report include all the materials used in those projects plus the labor to install those materials. And by the way: Those labor numbers include things like payroll taxes and worker’s comp insurance, as well as minimal benefits like holidays and sick days. These are things that all responsible remodelers include in their price. We also include the costs for any subcontractor work needed for the project. On top of all that, we add an industry standard percentage for general overhead that the remodeling company uses to cover the cost of an office, a website, a phone number, utilities, company vehicles, and equipment. Finally, this standard industry percentage also contains what we’d regard as a reasonable profit.
The 2018 report expands on past ones by providing data on 149 markets nationwide. We’ll continue to give value numbers for 100 of the biggest markets. Expect the report to come out in mid-January. For more, contact me.