
What a difference a year makes!
Few need reminders of the pall over the new home development and construction market a year ago. Asking prices spiraled up, fueled by input costs. Interest rates had risen, thanks to three Fed rate increases, and were a menacing upward arc. Add to that, a global trade war, a threatened government shutdown, and a recovery almost everyone agreed was too “long in the tooth” to expect to continue.
Readying for rough-going, many builders kicked into value capture mode, activating the knobs, switches, and levers in their tool set to protect, mitigate, defend, and monetize.
They rolled out incentives; they engineered out any costs that did not carry perceived value; they bent their own operational barriers to speed, to efficiency, to sales efficacy. Spiffy, smaller homes streamed into the new-home community current, better-trained and incentivized sales associates augmented by smarter data and engagement platforms, and 12 relatively robust months more of jobs and income reports converged to reignite traffic, sales, and closings, eclipsing tempered expectations.
All that, and, lo and behold, a 180-degree turn on the Fed’s part on the cost of borrowed money, and you’ve got outright forward-looking momentum.
And now, there’s a brand new measure–one that new home investment, development, and construction players have long-coveted, for all the data they currently have at their disposal–a New Home Pending Sales Index, from BUILDER sibling units Meyers Research and Metrostudy data.
That, in itself, is good news. On top of that, the inaugural reading of the brand spanking new measure is wholly positive in its outlook, at least for the near future rolling into January 2020.
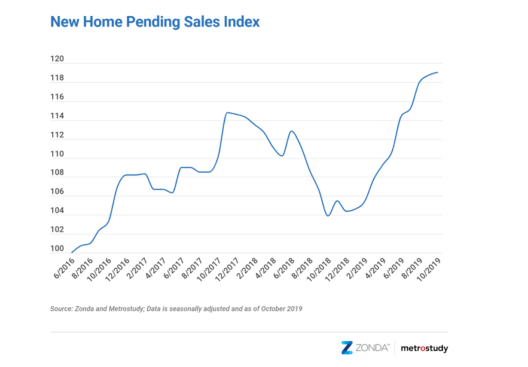
Today, the experts at Meyers Research, the housing industry’s foremost advisors, launched the inaugural New Home Pending Sales Index (PSI) for October 2019. The New Home PSI, backed by data from Zonda and Metrostudy, shows pending sales increased both year-over-year and month-over-month across the United States. The index is a leading residential real estate indicator based on the number of new home sales contracts signed across the country.
The New Home PSI came in at 119.0 for October, representing a 14.5% increase from October 2018. On a month-over-month basis, new home sales increased by 0.2% between September and October 2019.
While the Census Bureau’s monthly New Residential Sales serves as an important proxy to the relative health of the housing market, its deficiencies have been long-noted, including a margin of error that makes it prone to material upward and downward revisions, and the fact that it reflects “orders” that don’t necessarily tie to completed settlements. Cancellations, for example, are not accurately accounted for in Census New Home Sales data.
What’s more, New Home Sales data look back up to 60 days, and may not decipher seasonal or event-driven inflection points that builders, investors, and developers need to make forward-looking decisions.
The National Association of Realtors Pending Home Sales Index, on the other hand, calculates in-hand contracts, with earnest money behind them, that more accurately predict closings in the one or two months ahead.
The problem with the NAR metric–for home builder decision-support purposes–is that it includes both resales and new home contract signings, obscuring a view builders need to cadence their own permitting and resource allocations on a real-time basis.
Now the new-home business community–whose overall focus is moving forcefully toward real-time investment, operations, and resource allocation and away from far-ranging speculative investments and carrying-costs associated with multi-cycle land pipelines–has its own sensitive dashboard to trigger evenflow investment and operational responses to changing demand.
Further, the NHPSI will come out mid-month, while the Census and NAR benchmarks tend to be third or fourth week of the month reports. Here’s what Meyers Research has to say about its new data point.
“The US housing market regained momentum this year after a tough close to 2018,” said Ali Wolf, director of economic research at Meyers Research. “October’s new home sales capture stronger demand as lower mortgage rates, softer home price appreciation, and positive wage trends favor buyers.”
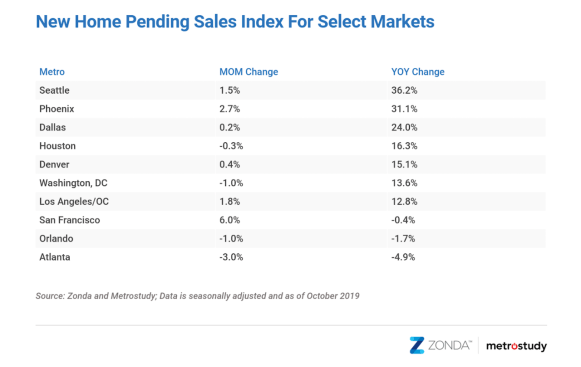
Seven of the ten key markets grew year-over-year and six of the ten increased month-over-month. Seattle, Phoenix, and Dallas experienced the most significant growth compared to last year, up 36.2%, 31.1%,and 24.0%, respectively.
Given the easy comp from the second half of 2018, looking at the two-year trend is very telling. The national index is 8.0% higher than October 2017. Phoenix, Dallas, and Houston show double-digit increases on a two-year basis. Phoenix, one of the worst-hit markets during the Great Recession, is at a cycle high.
Data revealed that the new home sales growth rate in Los Angeles moved in the positive direction for the first time since February of 2018. Sales in another California market, San Francisco, slowed in the second half of 2018 and is yet to fully recover. The market is trending in the right direction, though; sales were 0.4% lower year-over-year in October compared to down 7.3% in September.
When considering other factors occurring in the new home sales market Wolf observes, “Consumer confidence is the lifeblood of the housing market. Right now, we are seeing more shoppers encouraged by their employment situation and feel there’s value in buying a home today with rates sub-4.0%. As a result, the housing market in 2019 is expected to be the best of this expansion.”
New home data is susceptible to outsized swings in contract activity based on shifts in the number of actively selling communities. As a result, Meyers Research normalizes the data to ensure consistency across the index. The New Home PSI blends the cumulative sales of active or recently sold-out projects with the average sales rate per community, which adjusts for fluctuations in supply. Furthermore, the New Home PSI is seasonally adjusted based on each markets’ specific seasonality and removes outliers. The index is baselined to 100 for June2016. Today’s national New Home PSI is 19% above the base level.
The next Meyers Research New Home PSI press release, featuring November 2019 data, will be issued on Friday, December 20, 2019 at 9:00 a.m. ET.
Methodology
The Meyers Research New Home Pending Sales Index (PSI) is built on proprietary, industry-leading data that covers 60% of the production new home market across the United States. Reported number of new home pending contracts are gathered and analyzed each month. Released on the 15th business day of each month, the New Home PSI is a leading indicator of housing demand compared to closings because it is based on the number of signed contracts at a new home community. Meyers Research monitors 18,000 active communities in the country and the homes tracked can be in any stage of construction.
The new home market represents roughly10% of all transactions, allowing little movements in supply to cause outsized swings in market activity. As a result, the New Home PSI blends the cumulative sales of activity recently sold out projects with the average sales rate per community, which adjusts for fluctuations in supply. Furthermore, the New Home PSI is seasonally adjusted based on each markets’ specific seasonality,removes outliers, and uses June2016 as the base month. The foundation of the index is a monthly survey conducted by Meyers Research. It is necessary to monitor both new and existing home sales to establish an accurate picture of the relative health of the residential real estate market.
Are builders entirely “out of the woods” as they look forward into 2020 and beyond? Not by many measures, and with a December 20th deadline for Congress to approve a budget in an ever-more-contentious political landscape, we again could be looking at an end-of-the-year government shut-down.
But how about those interest rates?