The number of building material dealer firms nationwide declined 1.8% in 2015 from 2014 and the total number of LBM branches slipped 1.1%, a new Census Bureau report shows. At the same time, the number of employees at those businesses increased 1.9% and dealers’ employee payroll grew 5.9%.
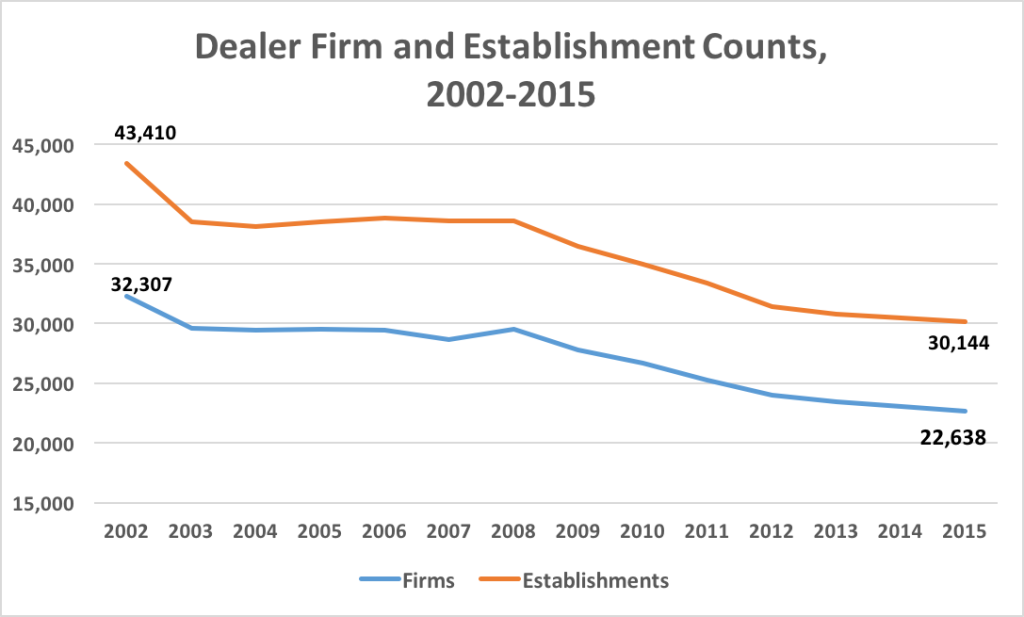
There was a total of 22,638 firms and 30,144 establishments classified as “Other Building Material Dealers” in the 2015 version of the federal government’s annual Statistics on U.S. Businesses report. The “other” category lumps together all firms that aren’t home centers, hardware stores, and paint and wallpaper stores. Both lumberyards and specialty dealers, such as roofing and drywall firms, are included in the “other” category.
The latest numbers, released in late September, continue LBM’s slow decline this century; the number of firms and establishments shrank 30% between 2002 and 2015, while the number of employees has fallen by 45%. But this report doesn’t look at how much revenue those firms are taken in. The Census Bureau now provides that data just once every five years.
Source: Census Bureau
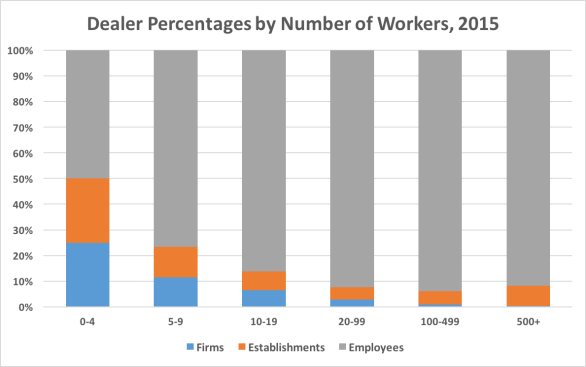
The report did reveal once again that there’s a huge difference between big and small dealers: firms with zero to four employees account for nearly 47% of all firms but just 8% of the employees, while companies with 100 or more employees represent just 2.6% of all firms but nearly 19% of all branches and 30% of all employees. Here’s how the Census Bureau breaks down the LBM community by the number of employees at each firm:
| Firms | Establishments | Employees | Payroll | |
| 0-4 | 10,590 | 10,619 | 21,233 | 819,342 |
| 5-9 | 5,449 | 5,580 | 36,120 | 1,386,219 |
| 10-19 | 3,454 | 3,813 | 45,257 | 2,027,343 |
| 20-99 | 2,560 | 4,460 | 85,429 | 4,101,988 |
| 100-499 | 453 | 2,270 | 41,341 | 2,090,223 |
| 500+ | 132 | 3,402 | 39,328 | 2,128,797 |
| % Firms | % Establshments | % Employees | % Payroll | |
| 0-4 | 46.8% | 35.2% | 7.9% | 6.5% |
| 5-9 | 24.1% | 18.5% | 13.4% | 11.0% |
| 10-19 | 15.3% | 12.6% | 16.8% | 16.1% |
| 20-99 | 11.3% | 14.8% | 31.8% | 32.7% |
| 100-499 | 2.0% | 7.5% | 15.4% | 16.6% |
| 500+ | 0.6% | 11.3% | 14.6% | 17.0% |
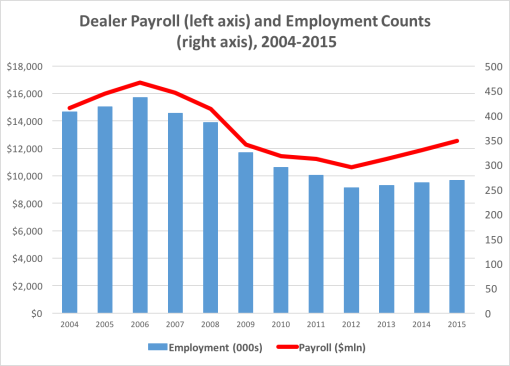
One number that has risen over the years is how much people are being paid.
Census Bureau
The total payroll grew 5.9% in 2015 from the previous year. Payroll per employee rose 3.9% to hit $46,720.